Venus Express Observations
The European Space Agency’s Venus Express (VEx) orbiter has carried out a large range of investigations which provide constraints on clouds at a range of altitudes:
– Nightside observations in near-infrared spectral windows have constrained lower cloud properties including particle size and composition, and vertical structure (VIRTIS and SPICAV-IR instruments, 48-55 km). [e.g. Barstow et al., Icarus 2012]
– Dayside nadir spectroscopy has been used to map cloud-top altitude and scale height (VIRTIS and SPICAV, 65-70 km). [e.g. Ignatiev et al., JGR-Planets, 2009; Cottini et al., Icarus 2012]
– Dayside imagery in UV to nIR wavelengths (using VMC and VIRTIS) reveals cloud morphology at 60-70 km altitude [e.g. Titov et al. 2012].
– Limb observations provide direct measurement of cloud-top altitude and scale height (SPICAV, VIRTIS and VMC, 70-75 km). [e.g. De Kok et al. Icarus 2011; Limaye et al. EGU 2013]
– Measurement of intensity and polarization phase functions of upper cloud by VMC and SPICAV [e.g. Markiewicz et al, EGU 2012; Rossi et al., EGU 2013]. Stellar occultations (SPICAV) and solar occultations (SOIR and SPICAV) measure the vertical structure and microphysical properties of hazes (particle size distribution and number density at 70-100 km). [e.g. Wilquet et al. JGR 2009]
– Radio occultation (VEx/VeRa experiment) measures vertical profiles of temperature structure, and thus of convective stability, at altitudes of 40 – 90 km; and it has also been used to measure the abundance of sulphuric acid vapour, the main cloud-forming condensable species, at 45-55 km [Oschlisniok et al., Icarus, 2012].
These observations – each of which has been carried out on hundreds of occasions – provide a rich dataset for cloud studies, and have revealed large variability on a range of temporal and spatial scales. However, the spatial coverage and resolution of each of these observations is very different, as shown below. All these datasets have until now been considered in isolation, in this ISSI activity we wish to bring together these separate analyses to form a unified picture of Venus cloud processes.
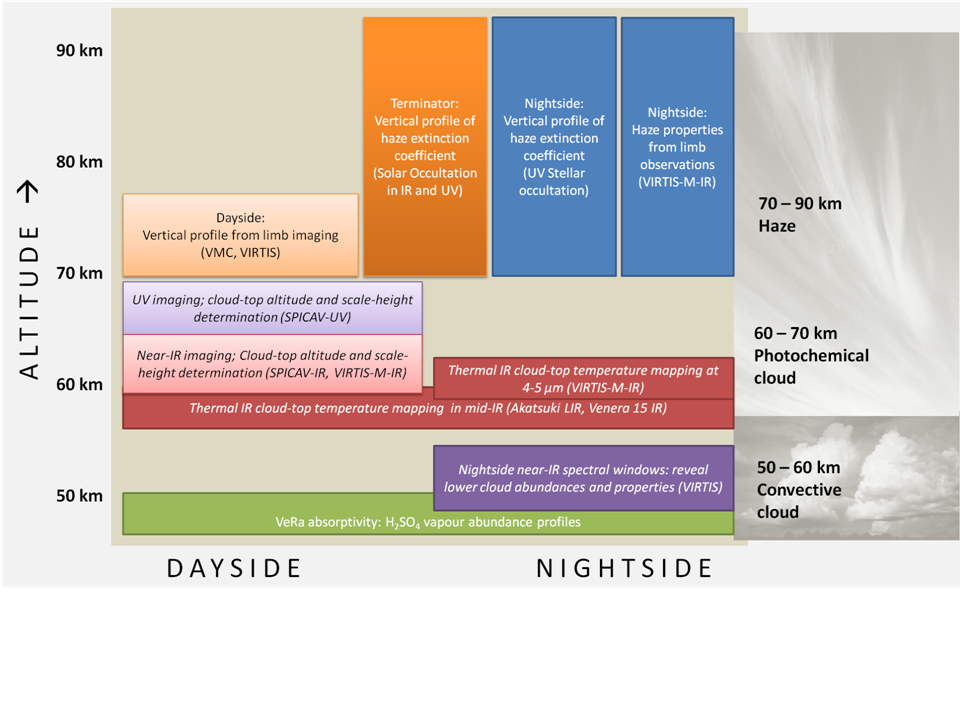
This figure depicts cloud/haze measurements in different altitude ranges probed by Venus Express instruments. Non-italic text denotes a vertical profiling measurement , while text in italics denotes a mapping measurement (measuring horizontal spatial variability within a single observation)..
Venus microphysical cloud modelling
Microphysical modeling of Venus clouds and hazes is a rapidly evolving field, with particularly active groups in France (Määttänen, Lefèvre et al), Japan (Imamura, Hashimoto et al.) and the USA, Boulder (McGouldrick et al.; Zhang, Gao et al.) and Pasadena (Zhang, Gao et al). All of these groups aim to incorporate cloud and haze particle models into 3-D atmospheric circulation models, which would enable the investigation of cloud-dynamics feedbacks – many of these models will incorporate chemistry and radiative processes as well. This will permit new investigations of what mechanisms cause the observed spatial and temporal cloud variations (in particular, the cloud-top UV contrasts and the lower and middle cloud optical thickness). Microphysical modeling of the Venus clouds is also necessary to understand whether the trimodal structure of the cloud particles observed in the lower and middle clouds by the Pioneer Venus descent probes is real and persistent, and if so, how? Is it a reflection of short time scale dynamical effects in the cloud structure or does it represent a variation in the microphysical drivers of the clouds?