1- Electric and magnetic lightning‐generated wave amplitudes measured by the Van Allen Probes
Lightning flashes emit powerful electromagnetic lightning‐generated waves (LGWs). Some of this power propagates and escapes into the magnetosphere. Resonant interactions of trapped electrons in the Van Allen belts with LGWs cause pitch angle diffusion, leading to scattering of those electrons into the atmosphere, an important process for estimating the radiation levels encountered by satellites in low Earth orbits.
Here, we analyze the electric and magnetic field wave measured by the two NASA Van Allen Probes during almost their entire mission (~24.6 million measurements of electric and magnetic LGW amplitudes, i.e. 80% of the entire mission). We compare these spacecraft observations with an estimate for the very low frequency (VLF) wave power escaping to space using the ground‐based World Wide Lightning Location Network (WWLLN) to measure lightning VLF radiation on Earth. We discuss the main features of the LGW amplitude distributions with respect to position relative to the Sun (local time), magnetic field lines (L‐shell, L), longitude, and time (month or season).
Our study reveals a region of low wave amplitude (9–15 hr MLT and L < 2) existing thanks to the denser dayside ionosphere, which prevents the intense equatorial lightning VLF waves from propagating through it. In addition, we find weaker wave amplitudes below L = 1.5 at all MLT, where the ground‐level lightning activity is maximal. This suggests a difficulty of lightning VLF waves to penetrate, or/and to propagate, or/and to remain at low L‐shells, certainly due to the denser ionosphere during daytime (in agreement with transmission theory), but probably, and more generally, also due to the high plasma density below L = 1.5 and the wave normal angles of the LGW emitted by lightning strokes. This may be an indication of an increase in wave normal angle of LGW as L decreases (e.g., Clilverd et al., 2008) that should be more deeply investigated.
On the contrary, the mean LGW power (or RMS) remains nearly constant for B (or increases for E) with respect to L‐shell. This is due to strong to extreme LGW that dominate the wave mean power to the point of compensating the decay of LGW occurrence at low L‐shell. Even though extreme LGW can be very powerful, particularly at low L and during night, the mean electric/magnetic power remains low compared with other whistler waves; LGW resonant effects on electrons are consequently long‐term effects that contribute to “age” trapped inner belt electron populations.

Ripoll, J.‐F., Farges, T., Malaspina, D. M., Lay, E. H., Cunningham, G. S., Hospodarsky, G. B., et al. (2020). Analysis of electric and magnetic lightning‐generated wave amplitudes measured by the Van Allen Probes. Geophysical Research Letters, 47, e2020GL087503. https://doi.org/ 10.1029/2020GL087503
https://agupubs.onlinelibrary.wiley.com/doi/abs/10.1029/2020GL087503?af=R
2- Persistent EMIC wave activity across the nightside inner magnetosphere
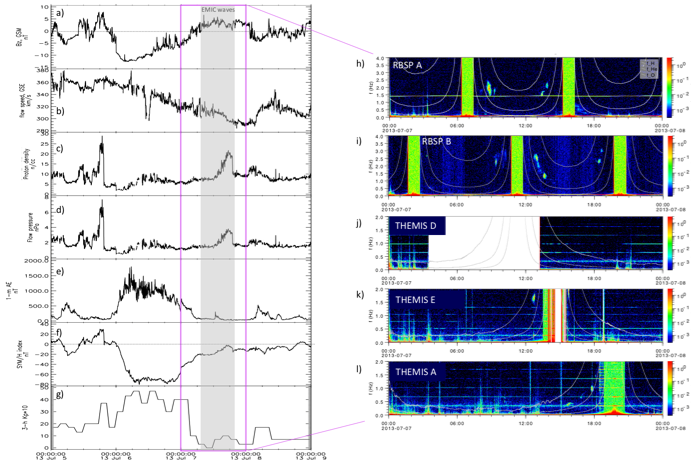
Electromagnetic ion cyclotron (EMIC) waves can act as a loss process for both ring current ions and radiation belt electrons, and the spatial and temporal characteristics of these waves are important for quantifying their effects on energetic particles. Here we utilize observations from multiple spacecraft to constrain the azimuthal and radial dimensions as well as the duration of an EMIC wave event occurring on the nightside of the inner magnetosphere on 7 July 2013. While these waves are often thought to be localized and of short durations, we observe an event on 7 July 2013 where waves persist for over 10 hr and span the entire nightside of the Earth. The solar wind conditions, geomagnetic activity, and plasma environment are also examined to better understand what causes these widespread, long‐lasting waves.
These studies reveal the following key points:
- The EMIC wave activity on 7 July is localized in L shell but spans 10+ hr in UT and nearly 12 hr in MLT. Multipoint in situ measurements support previous ground and in situ observations that EMIC waves are often radially narrow but extended in UT, confirming that single spacecraft measurements (particularly from highly elliptical orbits) can significantly underestimate EMIC wave durations.
- Wave activity occurs across the nightside of the inner magnetosphere during the recovery phase of a storm, where hot ions overlap an outwardly expanding plasmasphere over an extended range of local times. The more slowly varying storm recovery phase may allow the waves to persist in their given location for this extended period, compared to more dynamic storm and substorm periods.
- Local phase space density (PSD) minima are observed at μ ≥1,000 MeV/G concurrent with the EMIC wave activity, consistent with EMIC‐driven scattering and loss of MeV electrons from the outer radiation belt. Such persistent, extended EMIC waves have the potential to produce significant effects on energetic particle dynamics and loss in the inner magnetosphere.
Blum, L. W., Remya, B., Denton, M. H., & Schiller, Q. (2020). Persistent EMIC wave activity across the nightside inner magnetosphere. Geophysical Research Letters, 47, e2020GL087009. https://doi. org/10.1029/2020GL087009
https://agupubs.onlinelibrary.wiley.com/doi/abs/10.1029/2020GL087009
3- Observation of High‐Energy Electrons Precipitated by NWC Transmitter from PROBA‐V Low‐Earth Orbit Satellite, Geophysical Research Letters
Radio waves with a low enough frequency can reflect off Earth’s surface as well as the ionosphere. These waves bounce back and forth in the Earth‐ionosphere waveguide, enabling AM (Amplitude Modulation) radio to be heard at large distances. The ionosphere is not a perfect reflector, though, and some of the transmitter wave power escapes into Earth’s magnetosphere, a region where charged particles like electrons can be trapped for many months on magnetic field lines. The radio waves can scatter the trapped electrons into Earth’s atmosphere, where they rapidly lose energy and no longer pose a threat to space‐based assets. Understanding how naval transmitters scatter trapped electrons is needed to help us explain why electrons stay trapped for as long as they do, and enable us to predict radiation damage to the growing number of satellites that orbit Earth with low altitudes, which limits the satellite’s useful lifetime.
The very low‐frequency transmitter in the Northwest Cape of Australia (NWC) has previously been observed to pitch‐angle scatter electrons with energies from 30‐400 keV, creating enhanced fluxes measured by low‐Earth orbiting (LEO) satellites. Here we use observations from the Energetic Particle Telescope on PROBA‐V. We compare the measured flux, as a function of local magnetic field strength, when the NWC transmitter is “on” versus “off”, and find enhanced fluxes only when NWC is “on” and located on the night side. The enhanced fluxes occur in the population gradually transitioning from “permanently trapped” to “quasi‐trapped”. We show that electrons up to 800 keV, substantially higher energy than previously studied, are scattered by resonant interactions with NWC to produce enhanced fluxes. The enhanced fluxes appear at multiple L‐shells for each energy channel, consistent with resonance conditions at distinct wave normal angles, that indicate ducted interactions at L<1.55 and unducted interactions at L>1.65.
G. S. Cunningham E. Botek V. Pierrard C. Cully J.‐F. Ripoll, Observation of High‐Energy Electrons Precipitated by NWC Transmitter from PROBA‐V Low‐Earth Orbit Satellite, Geophysical Research Letters, https://doi.org/10.1029/2020GL089077
https://agupubs.onlinelibrary.wiley.com/doi/10.1029/2020GL089077
4- First direct observations of propagation of discrete chorus elements from the equatorial source to higher latitudes, using the Van Allen Probes and Arase satellites
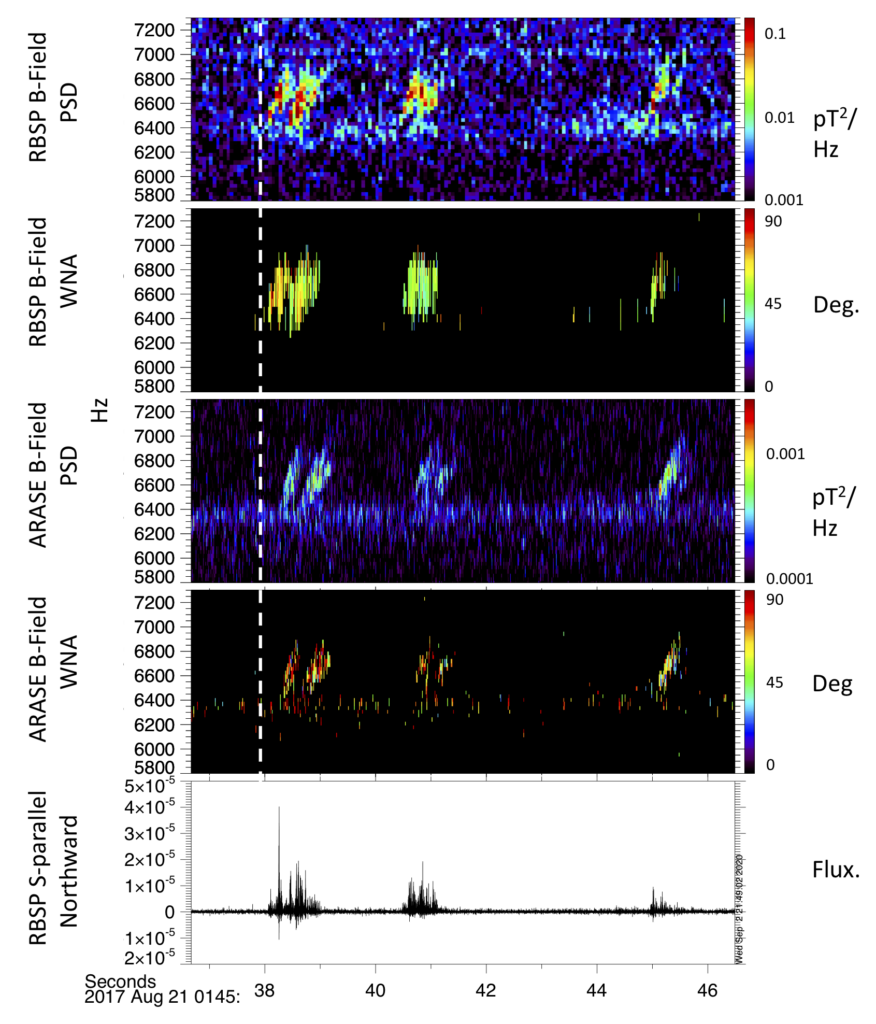
Whistler mode chorus waves have recently been established as candidate for scattering radiation belts electrons to produce the electron microbursts observed by low altitude satellites and balloons. These waves would have to propagate from the equatorial source region to significantly higher magnetic latitude in order to scatter these electrons. However, observations reveal chorus waves at higher latitudes tend to be more field-aligned and less attenuated than would be suggested by simple ray tracing. Additionally, the limited latitudinal range of existing satellites has until now precluded the direct observation of this propagation. As a result, this theoretically proposed propagation has never been directly observed. The launch of the Arase satellite with an orbit covering these higher magnetic latitudes and the presence of the Van Allen Probes in the equatorial plane allows us to directly observe chorus wave latitudinal propagation.
In Colpitts et al. (2020), we present the first direct observations of the same discrete rising tone chorus elements propagating from a near equatorial (Van Allen Probes) to an off-equatorial (Arase) satellite. The chorus is observed first on the more equatorial satellite, and is found to be more oblique and significantly attenuated at the off-equatorial satellite. This is consistent with the prevailing theory of chorus propagation, and with the idea that chorus must propagate from the equatorial source region to higher latitudes. Ray tracing of chorus at the observed frequencies confirms that these elements could be generated parallel to the field at the equator, and propagate through the medium unducted to Van Allen Probes A and then to Arase with the observed time delay, and have the observed obliquity and intensity at each satellite.
Colpitts, C., Miyoshi, Y., Kasahara, Y., Delzanno, G. L., Wygant, J. R., Cattell, C. A., et al. (2020). First direct observations of propagation of discrete chorus elements from the equatorial source to higher latitudes, using the Van Allen Probes and Arase satellites. Journal of Geophysical Research: Space Physics, 125, e2020JA028315. https://doi.org/10.1029/2020JA028315
https://agupubs.onlinelibrary.wiley.com/doi/10.1029/2020JA028315
5- Scattering by whistler-mode waves during a quiet period perturbed by substorm activity
In this article, we study the dynamics of radiation belt electrons during a 10-day quiet period perturbed by substorm activity and preceding a high-speed stream (HSS), aiming at a global description of the radiation belts in L-shell, L in [2, 6], and energy [0.1, 10] MeV. We combine Van Allen Probes observations and Fokker-Planck numerical simulations of pitch-angle diffusion. The Fokker-Planck model uses event-driven pitch angle diffusion coefficients from whistler-mode waves, built from the wave properties and the ambient plasma density measurements from the Van Allen Probes.
We first find this event has some similar characteristics to regular quiet times previously studied; a widely extended plasmasphere within which we observe strong and varying whistler-mode waves. These ambient conditions lead to strong pitch-angle scattering, which contributes to the creation of a wide slot region as well as a significant decay of the outer radiation belts, which are observed and qualitatively well simulated.
In addition and more importantly, we find the substorm activity causes short duration (within +/- 4h) decay of the plasma density and a lowering amplitude of the whistler-mode waves within the plasmasphere, both causing opposite effects in terms of pitch angle diffusion. This leads to a diminution of pitch-angle diffusion at the time of the main substorm activity. Conversely, whistler-mode waves become enhanced in the time periods between the substorm injections. All effects cumulated, we find an enhancement of pitch angle diffusion by whistler-mode waves above L~4.7 during the 10-day period. This directly relates to the combination of quietness and substorm activity which allows pitch angle diffusing of up to 1 MeV electrons in the outer belt. Relativistic electrons of 1 to 2 MeV remain trapped in the outer belt, from L~4.7 to L~5.2, forming, in both the observations and the simulations, a distinct pocket of remnant electrons.
J.-F. Ripoll, M. H. Denton, D. P. Hartley, G. D. Reeves, D. Malaspina, G. S. Cunningham, O. Santolík, S. A. Thaller, V. Loridan, J. F. Fennell, D. L. Turner, W. S. Kurth, C. A. Kletzing, M. G. Henderson, A. Y. Ukhorskiy (2020), Scattering by whistler-mode waves during a quiet period perturbed by substorm activity, Journal of Atmospheric and Solar-Terrestrial Physics, https://doi.org/10.1016/j.jastp.2020.105471.
https://www.sciencedirect.com/science/article/abs/pii/S1364682620302741
6- Electron dropout events and flux enhancements associated with geomagnetic storms observed by PROBA-V/EPT from 2013 to 2019
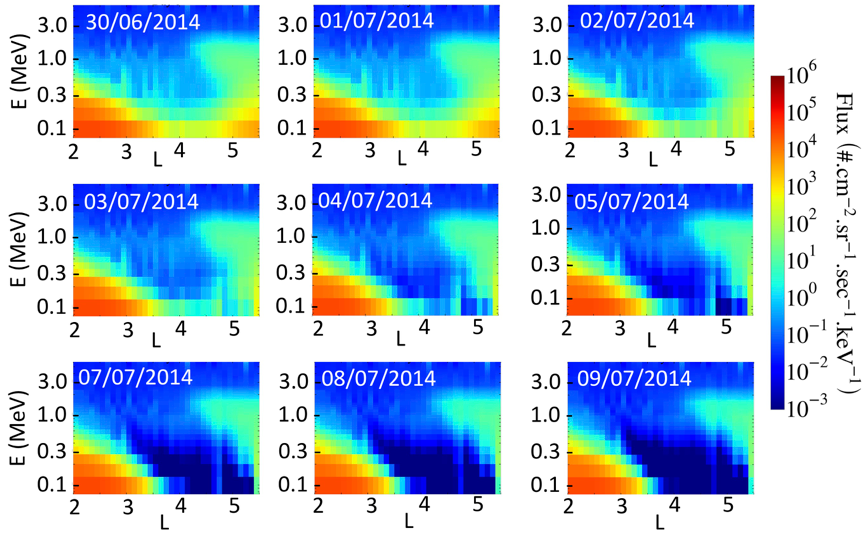
In this article, electron flux variations for E>500 keV during geomagnetic storms are investigated using the Energetic Particle Telescope (EPT). This detector launched in May 2013 on board the satellite PROBA‐V at an altitude of 820 km was designed to provide uncontaminated spectra of electrons, protons and alpha particles.
Electron flux dropout events are observed during the main phase of each storm and even during substorms: a rapid reduction of the electron flux is noted throughout the outer electron radiation belt at all energies above about 0.5 MeV on timescales of a few hours. The electron spectrograms measured by the EPT between 2013 and 2019 show that after each geomagnetic storm, dropout events are followed by a flux enhancement starting first at low L values, and reaching the slot or even the inner belt for the strongest storms (cf Figure below).
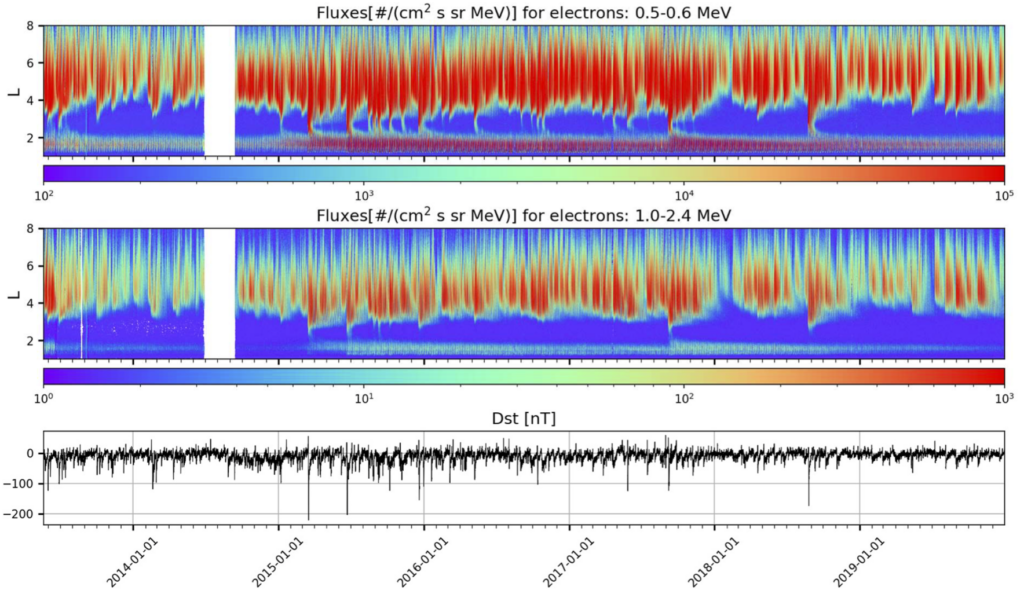
We can see dropouts appear at all energies measured by EPT and penetrate down to L∼3.5 for the strongest events. Dropouts are observed at LEO each time Dst has an inverted peak < ‐40 nT. Flux enhancements appear at lower L only for big storm events with Dst < ‐50 nT. They penetrate down to an impenetrable barrier with a minimum L‐shell related to Dst and to the energy. For E > 1 MeV, this limit is also linked to the plasmapause position.
Finally, we determine the link between Disturbed Storm Time (Dst) and the minimum value of the L‐shell where the dropouts deplete the outer belt, as well as the non‐linear relation between Dst and the minimum L‐shell where the flux penetrates in the slot region or even the inner belt during the storms.
Pierrard, V., Botek, E., Ripoll, J. F., & Cunningham, G. (2020). Electron dropout events and flux enhancements associated with geomagnetic storms observed by PROBA‐V/EPT from 2013 to 2019. Journal of Geophysical Research: Space Physics, 125, e2020JA028487. https://doi.org/10.1029/2020JA028487
7- Evolution of pitch angle distributions of relativistic electrons during geomagnetic storms
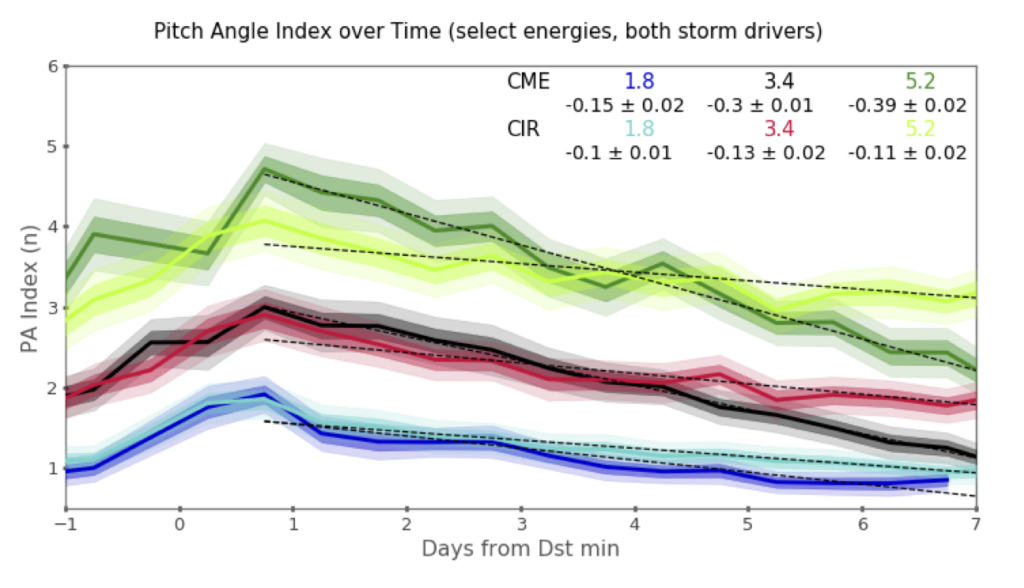
This is a study analyzing relativistic and ultra-relativistic electron energization and the evolution of pitch angle distributions using data from the Van Allen Probes. We study the connection between energization and isotropization to determine if there is a coherence across storms and across energies. Pitch angle distributions are fit with a sine function to the power n, and the variable ’n’ is characterized as the pitch angle index and tracked over time.
Our results show that, consistently across all storms with ultra-relativistic electron energization, electron distributions are most anisotropic within around a day of the minimum Dst and become more isotropic in the following week. Also, each consecutively higher energy channel is associated with higher anisotropy after storm main phase. Changes in the pitch angle index are reflected in each energy channel; when 1.8 MeV electron pitch angle distributions increase (or decrease) in pitch angle index, so do the other energy channels. We show that the peak anisotropies differ between CME- and CIR- driven storms and measure the relaxation rate as the anisotropy falls after the storm. The isotropization rate in pitch angle index for CME-driven storms is -0.15±0.02 day−1 at 1.8 MeV, -0.30±0.01 day−1 at 3.4 MeV, and -0.39±0.02 day−1 at 5.2 MeV. For CIR-driven storms, the isotropization rates are -0.10±0.01 day−1 for 1.8 MeV, -0.13±0.02 day−1 for 3.4 MeV, and -0.11±0.02 day−1 for 5.2 MeV. This study shows that there is a global coherence across energies and that storm type may play a role in the evolution of electron pitch angle distributions.
Greeley A.D., S. G. Kanekal, D. G. Sibeck, Q. Schiller, D. N. Baker (2020). Evolution of pitch angle distributions of relativistic electrons during geomagnetic storms: Van Allen Probes Observations, Journal of Geophysical Research: Space Physics, accepted
https://agupubs.onlinelibrary.wiley.com/doi/10.1029/2020JA028335
8- Testing the Organization of Lower-Band Whistler-Mode Chorus Wave Properties by Plasmapause Location
Lower-band whistler-mode chorus waves are important to the dynamics of Earth’s radiation belts, playing a key role in accelerating seed population electrons (hundreds of keV)
to relativistic (>1 MeV) energies, and in scattering electrons such that they precipitate into the atmosphere.
When constructing and using statistical models of lower-band whistler-mode chorus
wave power, it is commonly assumed that wave power is spatially distributed with respect to magnetic L-shell. At the same time, these waves are known to drop in power at the plasmapause, a cold plasma boundary which is dynamic in time and space relative to L-shell. This study organizes wave power and propagation direction data with respect to distance from the plasmapause location to evaluate what role the location of the plasmapause may play in defining the spatial distribution of lower-band whistler-mode chorus wave power. It is found that characteristics of the statistical spatial distribution of equatorial lower-band whistler-mode chorus are determined by L-shell and are largely independent of plasmapause location.
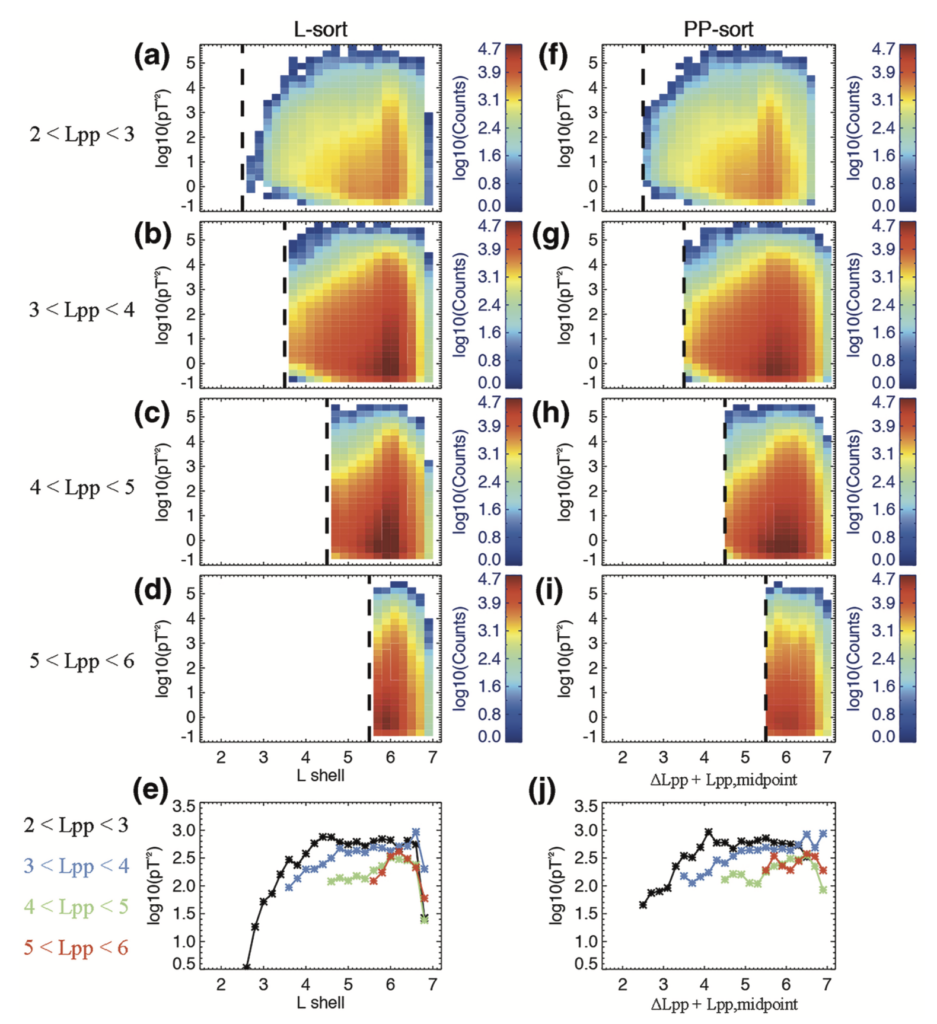
The lack of systematic difference between the data when sorted by L-shell or by distance from the plasma- pause supports the long-used assumption that equatorial lower-band whistler-mode chorus wave properties are physically organized by L-shell. Therefore, quasi-linear diffusion models of radiation belt dynamics are expected to produce similar results whether they use L-sorted data or plasmapause-sorted data for low- er-band whistler-mode chorus waves.
The primary physical importance of the plasmapause is to act as an Earthward boundary to lower-band whistler-mode chorus wave activity. This behavior is consistent with an equatorial lower-band whistler-mode chorus wave power spatial distribution that follows the L-shell organization of the particles driving wave growth.
Malaspina, D. M., Jaynes, A. N., Elkington, S., Chan, A., Hospodarsky, G., & Wygant, J. (2021). Testing the organization of lower-band whistler- mode chorus wave properties by plasmapause location. Journal of Geophysical Research: Space Physics, 126, e2020JA028458. https://doi. org/10.1029/2020JA028458
https://agupubs.onlinelibrary.wiley.com/doi/epdf/10.1029/2020JA028458
9- Observations and simulations of dropout events and flux decays in October 2013: Comparing MEO equatorial with LEO polar orbit
We compare ESA PROBA-V observations of electron flux at LEO with those from the NASA Van Allen Probes mostly at MEO for October 2013.
We find a very good overlap of the outer belt at MEO and LEO at ∼0.5 MeV. Dropouts, corresponding to flux depletions at L > 4 (e.g., Pierrard et al., 2020), are clearly visible at all energies during four storms occurring on October 2, 9, 15, and 30, 2013 from observations by both EPT at LEO and MagEIS at MEO. These dropouts can be understood by the outward motion associated with the Dst event. To illustrate it, we performed relativistic gyromotion test particle simulations to quantify the effect of the betatron mechanism caused by the main phase of a geomagnetic storm on the relativistic electron flux. This way, we calculated the contribution of the Dst effect on the observed electron dropout.
During the main phase of a geomagnetic storm, test-particle simulations show that outer radiation belt particles are momentarily driven outward and decelerate, which temporally limits atmospheric scattering at both the highest latitude and the lowest L-shells of the outer belt. Because of this outward motion, scattering is temporarily shifted to higher altitude and latitude. Conversely, during the early recovery phase, electrons drift reversibly back inward. As they do so, scattering at the lowest L-shell and highest latitudes becomes observable again. Therefore, at fixed L-shell, one can observe first a decay of the precipitating flux at LEO, followed by a return to the normal state, which is due to the temporal motion outward, then, inward, of the particles during the storm main and recovery phases. Dst effect, associated with magnetopause shadowing and radial diffusion can explain the main characteristics of outer radiation belt electron dropouts in October 2013.
Equatorially trapped electron fluxes are higher than electron fluxes at LEO by 102 (<1 MeV) to 105 (>2.5 MeV). We observe a quite isotropic structure of the outer belt during quiet times, contrary to the inner belt, and pitch angle dependence of high energy injection.

We observe an interesting quite high energy injection of 459 keV electrons, which occurred during the October 2 storm and penetrated the inner belt. This injection is not observed at higher energies by RBSP and, thus not seen by EPT, which first channel starts at 0.5 MeV. The particularity of this injection is to have a rather strong pitch angle dependence, with the injection well observed at 90° pitch angle and hardly visible at 41° and 25°.
We also use Fokker-Planck simulations with event-driven diffusion coefficients at high temporal resolution, to distinguish instantaneous loss from the gradual scattering that depopulates the slot region and the outer belt after storms. Simulations reproduce the slot formation and the gradual loss in the outer belt. The typical energy dependence of these losses leads to the absence of scattering for relativistic and ultra-relativistic electrons in the outer belt, oppositely to dropouts.
Pierrard, V., Ripoll, J.-F., Cunningham, G., Botek, E., Santolik, O., Thaller, S., et al. (2021). Observations and simulations of dropout events and flux decays in October 2013: Comparing MEO equatorial with LEO polar orbit. Journal of Geophysical Research: Space Physics, 126, e2020JA028850. https://doi.org/10.1029/2020JA028850
https://agupubs.onlinelibrary.wiley.com/doi/10.1029/2020JA028850
10- Electromagnetic power of lightning superbolts from Earth to space
Lightning superbolts are the most powerful and rare lightning events with intense optical emission, first identified from space. Superbolt events occurred in 2010-2018 could be localized by extracting the high energy tail of the lightning stroke signals measured by the very low frequency ground stations of the World-Wide Lightning Location Network.
In this work, we report electromagnetic observations of superbolts from space using Van Allen Probes satellite measurements, and ground measurements, and with two events measured both from ground and space. From burst-triggered measurements, we compute electric and magnetic power spectral density for very low frequency waves driven by superbolts, both on Earth and transmitted into space, demonstrating that superbolts transmit 10-1000 times more powerful very low frequency waves into space than typical strokes and revealing that their extreme nature is observed in space.
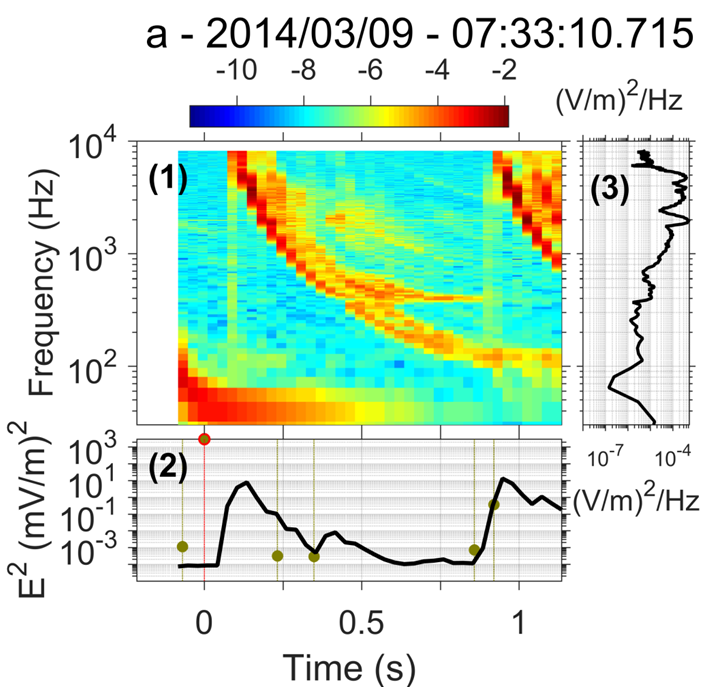
We find several properties of superbolts that notably differ from most lightning flashes; a more symmetric first ground-wave peak due to a longer rise time, larger peak current, weaker decay of electromagnetic power density in space with distance, and a power mostly confined in the very low frequency range.
On the ground, superbolt median peak current estimate is 363 kA, ~10 times higher than normal lightning (5a). 15% of superbolts are positive cloud-to-ground (+CG) flashes, compared with 28% of +CG lightning triggered during the whole campaign. While a typical rise time of normal lightning is 1-2 µs (up to 5µs), superbolts last longer, 5-6 µs (up to 15 µs). The decay time of the ground wave (from maximum to zero) is between 50-90 µs for normal negative cloud-to-ground (-CG) lightning, giving a well-known asymmetric shape to the ground wave for normal strokes. On the contrary, superbolts have a fast decay time of 10-20 µs, comparable to the rise time, leading to a more symmetric ground wave. This remarkable symmetry of the discharge, existing, for instance, for narrow bipolar pulses, could help reveal physical differences between superbolts and other lightning. The median of the ground wave electric field (reported at ground distance of 100 km) is +240 V/m to be compared with +/-20 V/m for normal lightning. Median squared electric field, computed over 1.5 ms is 2.6 (V/m)2 on the ground, about 100 times higher than for normal strokes. We find on average 38% of the total power (2 kHz-5 MHz) is in the VLF range (2-12 kHz) for normal lightning while this percentage reaches 68% for superbolts. This percentage increases as the lightning power increases. This suggests that is the longer duration of powerful lightning that populates the lowest frequencies of the VLF range.
In space, superbolts are rare during day time, with 5/66 events occurring from ~9am to ~5pm local time. Yet there is no sensitivity to day/night measured on the ground. This local time dependence is similar to the one found for non-superbolt lightning-generated waves and supports previous findings that the daytime ionosphere makes the propagation of any lightning-generated waves into the magnetosphere more difficult. Superbolts have a longtime delay (0.1-0.8 s) that corresponds to propagation time in the Earth-ionosphere waveguide and along field lines in the magnetosphere to the satellite, with some possible reflection between the conjugate points. Of the 10,724 superbolt events identified by WWLLN in 2012–2018, 431 WWLLN-detected superbolts were also captured by EMFISIS lower-resolution survey mode data between 2012-2018. We show that survey-mode superbolt average power is statistically larger than normal lightning, but not as powerful as burst-mode determined average power. The burst-mode squared electric/magnetic field which is found to be 10-1000 times more powerful than normal lightning. The three strongest events have a ~250 pT (6 mV/m) wave magnetic (electric) rms amplitude. The mean magnetic (electric) rms amplitude of the 66 superbolts is 83 pT (873 µV/m). In comparison, the mean magnetic (electric) rms amplitudes of lightning-generated waves computed from survey measurements of all types of lightning strokes (possibly including superbolts) is ~83 (~43) times lower, with 1 ± 1.6 pT (19 ± 59 μV/m)22.
These results have implications for our understanding of lightning and superbolts, for ionosphere- magnetosphere wave transmission, wave propagation in space, and remote sensing of extreme events.
J.-F. Ripoll, T. Farges, D. M. Malaspina, G. S. Cunningham, E. H. Lay, G. B. Hospodarsky, C. A. Kletzing, J. R. Wygant and S. Pédeboy, Electromagnetic power of lightning superbolts from Earth to space. Nat Commun 12, 3553 (2021). https://doi.org/10.1038/s41467-021-23740-6
https://www.nature.com/articles/s41467-021-23740-6
11- Can Earth’s magnetotail plasma sheet produce a source of relativistic electrons for the radiation belts?
Simultaneous observations from Van Allen Probes in Earth’s outer radiation belt (∼4–6 R ) and Magnetospheric Multiscale (MMS) in the magnetotail plasma sheet at >20 RE geocentric distance are used to compare relative levels of relativistic electron phase space density (PSD) for constant values of the first adiabatic invariant, M. We present new evidence from two events showing: (a) at times, there is sufficient PSD in the central plasma sheet to provide a source of >1 MeV electrons into the outer belt; (b) the most intense levels of relativistic electrons are not accelerated in the solar wind or transported from the inner magnetosphere and thus must be accelerated rapidly (within ∼minutes or less) and efficiently across a broad region of the magnetotail itself; and (c) the highest intensity relativistic electrons observed by MMS were confined within only the central plasma sheet. The answer to the title question here is: yes, it can, however whether Earth’s plasma sheet actually does provide a source of several 100s keV to >1 MeV electrons to the outer belt and how often it does so remain important outstanding questions.
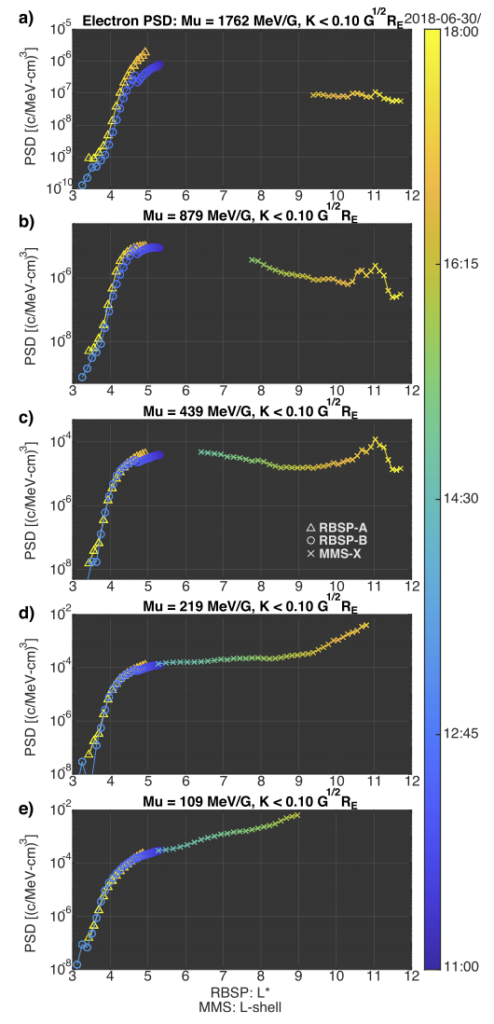
to 18:00 UT (time in color) on June 30, 2018. RBSP data are plotted versus third adiabatic invariant, L*, for second adiabatic invariant K of 0.09 G1/2RE. MMS data are plotted versus L-shell and were calculated using electrons at local 90° pitch angles. Panels (a–e) show results from different values of the first adiabatic invariant, M, ranging from 109 MeV/G (e) to 1,762 MeV/G (a), as labeled in the title of each panel.
Turner, D. L., Cohen, I. J., Michael, A., Sorathia, K., Merkin, S., Mauk, B. H., et al. (2021). Can Earth’s magnetotail plasma sheet produce a source of relativistic electrons for the radiation belts? Geophysical Research Letters, 48, e2021GL095495. https://doi.org/10.1029/2021GL095495
https://doi.org/10.1029/2021GL095495
12- Propagation and Dispersion of Lightning-Generated Whistlers Measured From the Van Allen Probes
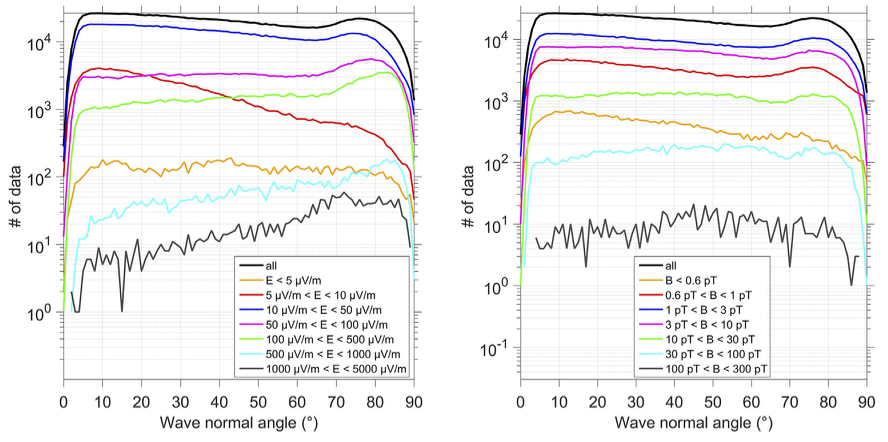
We study the propagation and attenuation of lightning-generated whistler (LGW) waves in near-Earth space (L ≤ 3) through the statistical study of three specific quantities extracted from data recorded by NASA’s Van Allen Probes mission, from 2012 to 2019: the LGW electric and magnetic power attenuation with respect to distance from a given lightning stroke, the LGW wave normal angle in space, and the frequency-integrated LGW refractive index. We find that LGW electric field wave power decays with distance mostly quadratically in space, with a power varying between -1 and -2, while the magnetic field wave power decays mostly linearly in space, with a power varying between 0 and -1. At night only, the electric wave power decays as a quadratic law and the magnetic power as a linear law, which is consistent with electric and magnetic ground measurements. Complexity of the dependence of the various quantities is maximal at the lowest L-shells (L < 1.5) and around noon, for which LGW are the rarest in Van Allen Probes measurements. In-space near-equatorial LGW wave normal angle statistics are shown for the first time with respect to magnetic local time (MLT), L-shell (L), geographic longitude, and season. A distribution of predominantly electrostatic waves is peaked at large wave normal angle. Conversely, the distribution of electromagnetic waves with large magnetic component and small electric component is peaked at small wave normal angle. Outside these limits, we show that, as the LGW electric power increases, the LGW wave normal angle increases. But, as the LGW magnetic power increases, the LGW wave normal angle distribution becomes peaked at small wave normal angle with a secondary peak at large wave normal angle. The LGW mean wave-normal angle computed over the whole data set is 41.6° with a ∼24° standard deviation. There is a strong MLT-dependence, with the wave normal angle smaller for daytime (34.4° on average at day and 46.7° at night). There is an absence of strong seasonal and continental dependences of the wave-normal angle. The statistics of the LGW refractive index show a mean LGW refractive index is 32 with a standard deviation of ∼26. There is a strong MLT-dependence, with larger refractive index for daytime 36) than for nighttime (28). Smaller refractive index is found during Northern hemisphere summer for L-shells above 1.8, which is inconsistent with Chapman ionization theory and consistent with the so-called winter/seasonal anomaly. Local minima of the mean refractive index are
Ripoll J-F, Farges T, Malaspina DM, Cunningham GS, Hospodarsky GB, Kletzing CA and Wygant J R (2021), Propagation and Dispersion of Lightning-Generated Whistlers Measured From the Van Allen Probes. Front. Phys. 9:722355. doi: 10.3389/fphy.2021.722355
https://www.frontiersin.org/articles/10.3389/fphy.2021.722355/full
13- Prompt response of the dayside magnetosphere to discrete structures within the sheath region of a coronal mass ejection
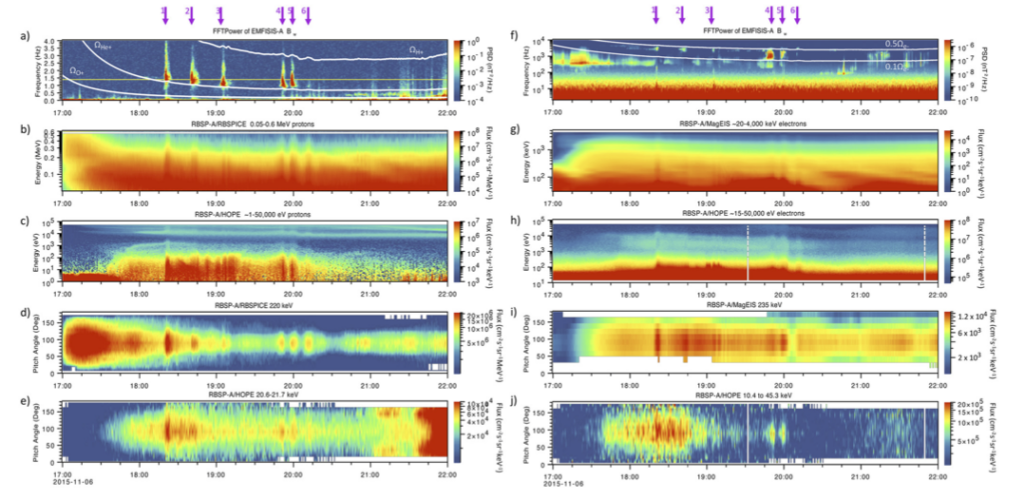
A sequence of discrete solar wind structures within the sheath region of an interplanetary coronal mass ejection on November 6, 2015, caused a series of compressions and releases of the dayside magnetosphere. Each compression resulted in a brief adiabatic enhancement of ions (electrons) driving bursts of electromagnetic ion cyclotron (EMIC; whistler mode chorus) wave growth across the dayside magnetosphere. Fine-structured rising tones were observed in the EMIC wave bursts, resulting in nonlinear scattering of relativistic electrons in the outer radiation belt. Multipoint observations allow us to study the spatial structure and evolution of these sheath structures as they propagate Earthward from L1 as well as the spatio-temporal characteristics of the magnetospheric response. This event highlights the importance of fine-scale solar wind structure, in particular within complex sheath regions, in driving dayside phenomena within the inner magnetosphere.
Blum, L. W., Koval, A., Richardson, I. G., Wilson, L. B., Malaspina, D., Greeley, A., & Jaynes, A. N. (2021). Prompt response of the dayside magnetosphere to discrete structures within the sheath region of a coronal mass ejection. Geophysical Research Letters, 48, e2021GL092700. https://doi.org/10.1029/2021GL092700
https://doi.org/10.1029/2021GL092700
14- Links of the Plasmapause With Other Boundary Layers of the Magnetosphere: Ionospheric Convection, Radiation Belt Boundaries, Auroral Oval
The plasmapause marks the limit of the plasmasphere and is characterized by a sudden change in plasma density. This can influence the other regions of the magnetosphere, including due to different waves circulating inside and outside the plasmasphere. In the present work, we first compare the positions of the plasmapause measured by the NASA Van Allen Probes in 2015 with those of the SWIFF plasmasphere model (SPM). Using the Van Allen Probes and other satellite observations like PROBA-V, we investigate the links that can exist with the radiation belt boundaries. The inward motion of the outer radiation belt associated with sudden flux enhancements of energetic electrons can indeed be directly related to the plasmapause erosion during geomagnetic storms, suggesting possible links. Moreover, the position of the plasmapause projected in the ionosphere is compared with the ionospheric convection boundary. The equatorward motion of the plasmapause projected in the ionosphere is related to the equatorward edge motion of the auroral oval that goes to lower latitudes during storms due to the geomagnetic perturbation, like the low altitude plasmapause and the outer radiation belt. The links between these different regions are investigated during quiet periods, for which the plasmasphere is widely extended, as well as during geomagnetic storms for which plumes are generated, and then afterwards rotates with the plasmasphere. The magnetic local time dependence of these boundaries is especially studied on 14 March 2014 after a sudden northward turning of the interplanetary magnetic field (IMF) and for the geomagnetic storm of 26 August 2018, showing the importance of the magnetic field topology and of the convection electric field in the interactions between these different regions eventually leading to the coupling between magnetosphere and ionosphere.
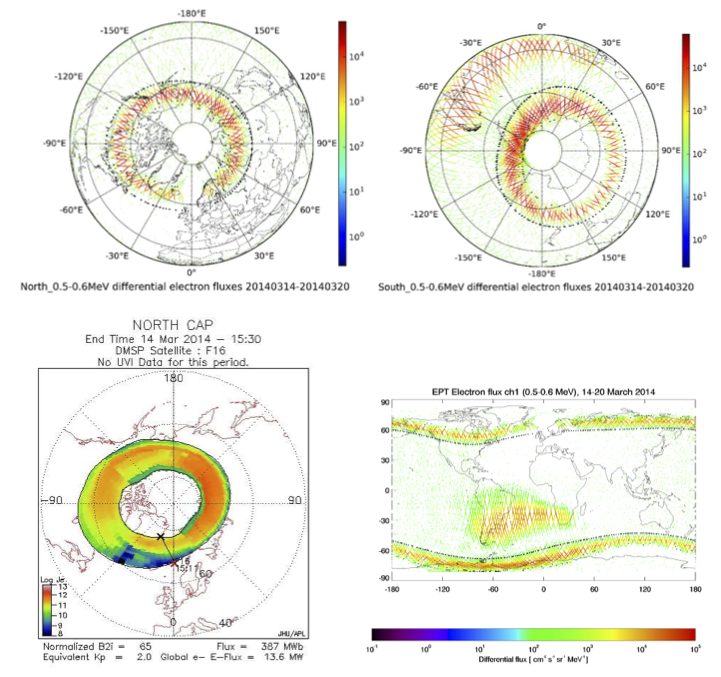
Northern hemisphere for 14 March 2014 at 15h30. The color scale indicates the energy flux . The dotted circles correspond to constant latitudes of 80°, 60° and 40°. (Right) The EPT observations of electron fluxes represented on a latitude/longitude map with the SAA at low latitudes and the outer belt at high latitudes. The black dots correspond to L=3.5 (inner equatorward edge) and L=8.5 (outer polar edge).
Pierrard V, Botek E, Ripoll J-F, Thaller SA, Moldwin MB, Ruohoniemi M and Reeves G (2021) Links of the Plasmapause With Other Boundary Layers of the Magnetosphere: Ionospheric Convection, Radiation Belt Boundaries, Auroral Oval. Front. Astron. Space Sci. 8:728531. doi: 10.3389/fspas.2021.728531.
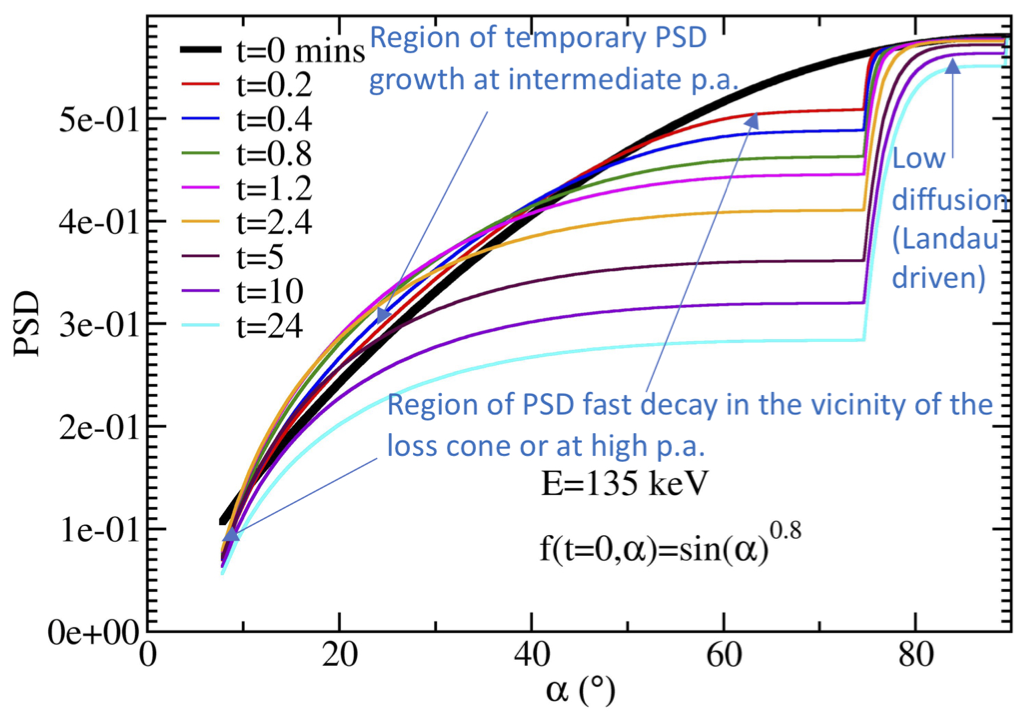
15- Early-time Non-equilibrium Pitch Angle Diffusion of Electrons by Whistler-mode Hiss in a Plasmaspheric Plume Associated with BARREL Precipitation
In August 2015, the Balloon Array for Radiation belt Relativistic Electron Losses (BARREL) observed precipitation of energetic (<200 keV) electrons magnetically conjugate to a region of dense cold plasma as measured by the twin Van Allen Probes spacecraft. The two spacecraft passed through the high density region during multiple orbits, showing that the structure was spatial and relatively stable over many hours. The region, identified as a plasmaspheric plume, was filled with intense hiss-like plasma waves. We use a quasi-linear diffusion model to investigate plume whistler-mode hiss waves as the cause of precipitation observed by BARREL. The model input parameters are based on the observed wave, plasma and energetic particle properties obtained from Van Allen Probes. Diffusion coefficients are found to be largest in the same energy range as the precipitation observed by BARREL, indicating that the plume hiss waves were responsible for the precipitation. The event-driven pitch angle diffusion simulation is also used to investigate the evolution of the electron phase space density (PSD) for different energies and assumed initial pitch angle distributions. The results show a complex temporal evolution of the phase space density, with periods of both growth and loss. The earliest dynamics, within the ~5 first minutes, can be controlled by a growth of the PSD near the loss cone (by a factor up to ~2, depending on the conditions, pitch angle, and energy), favored by the absence of a gradient at the loss cone and by the gradients of the initial pitch angle distribution. Global loss by 1-3 orders of magnitude (depending on the energy) occurs within the first ~100 mins of wave-particle interaction. The prevalence of plasmaspheric plumes and detached plasma regions suggests whistler-mode hiss waves could be an important driver of electron loss even at high L-value (L~6), outside of the main plasmasphere.
Millan, R, J.-F. Ripoll, O. Santolik, W. Kurth, (2021), Early-time Non-equilibrium Pitch Angle Diffusion of Electrons by Whistler-mode Hiss in a Plasmaspheric Plume Associated with BARREL Precipitation, Front. Astron. Space Sci., https://doi.org/10.3389/fspas.2021.776992.
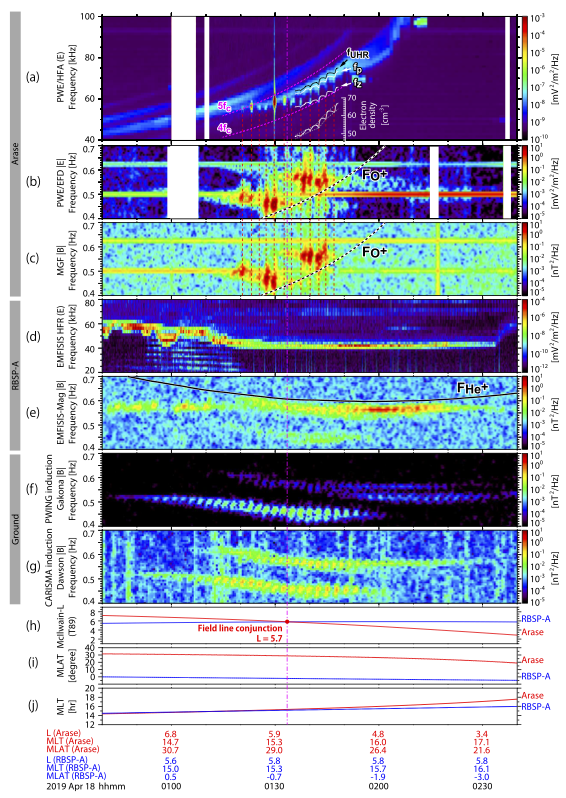
16- Multipoint Measurement of Fine-Structured EMIC Waves by Arase, Van
Allen Probe A and Ground Stations
We examined the growth and propagation of fine-structured electromagnetic ion cyclotron (EMIC) waves related to time-varying density irregularities using multipoint measurement data observed by Arase, Van Allen Probe A, and two ground-based induction magnetometers (Gakona and Dawson) during a field line conjunction event on 18 April 2019. We analyzed the wave data obtained by the aforementioned spacecraft and stations, and found that the appearance of fine structures in the observed EMIC waves clearly coincided with the ambient electron density irregularities in the magnetosphere, which can cause periodic wave growth and waveguiding on their propagation. Furthermore, we found that the latitudinal widths of the EMIC wave activity region and the wave propagation duct were approximately 185 km and less than 80 km at an auroral altitude of 100 km, respectively. We also found thermal ion heating (< 200 eV/q) during the EMIC wave activity.
Matsuda, S., Y. Miyoshi, Y. Kasahara, L. Blum, C. Colpitts, K. Asamura, Y. Kasaba, A. Matsuoka, F. Tsuchiya, A. Kumamoto, M. Teramoto, S. Nakamura, M. Kitahara, and I. Shinohara, Multipoint Measurement of Fine-Structured EMIC Waves by Arase, Van
Allen Probe A and Ground Stations, Geophys. Res. Lett., doi:10.1029/2021GL096488, 2021.
Link at https://agupubs.onlinelibrary.wiley.com/doi/epdf/10.1029/2021GL096488
17- Using VLF Transmitter Signals at LEO for Plasmasphere Model Validation
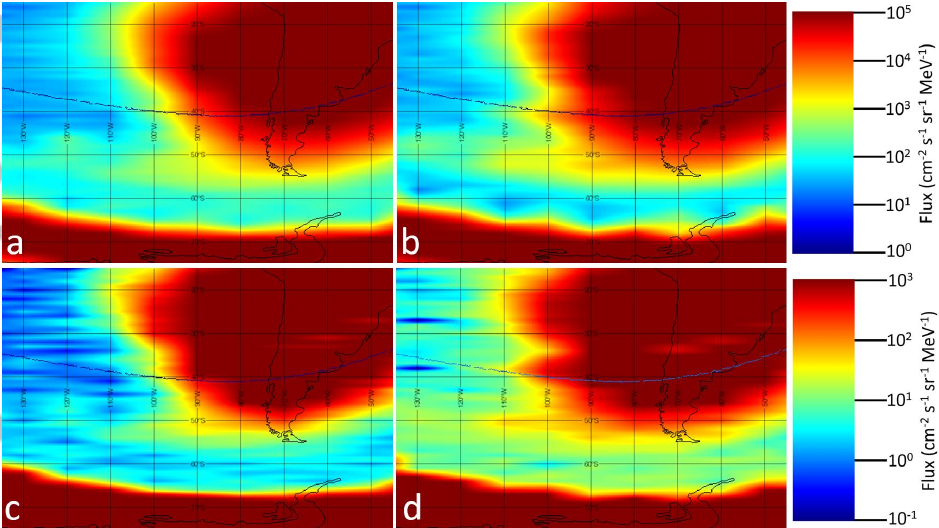
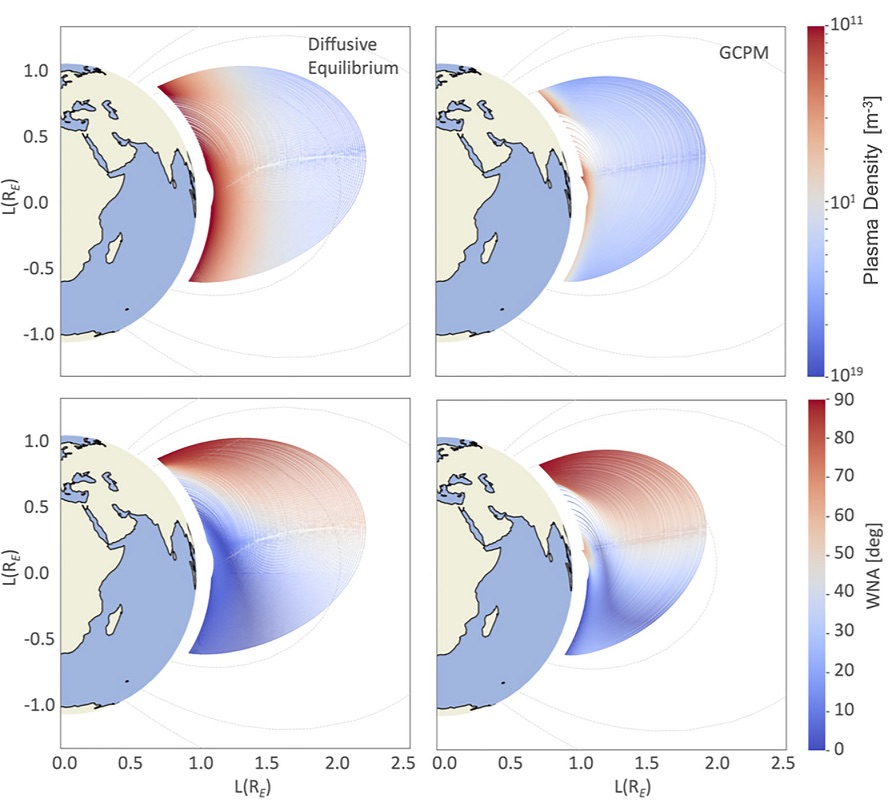
Very low frequency (VLF) transmitter signals at frequencies in the tens of kHz, used for military communication with submerged submarines, can be used to determine the plasma density distribution in near-Earth space. Here we demonstrate how a combination of VLF antenna measurements from low-Earth orbit and numerical modeling of VLF signal propagation can be applied to constrain plasma density profiles in the magnetosphere. This is an indirect method that can be used for plasmaspheric density model validation as an alternative to multipoint in situ plasma measurements that may not be readily obtainable.
In more detail, this study presents analysis of very low frequency (VLF) transmitter signal measurements on the Very-Low-Frequency Propagation Mapper (VPM) CubeSat in low-Earth orbit. Six months of satellite operation provided good data coverage, used to build global statistical maps of VLF power distribution. The power distribution above four powerful transmitters is used as input for simulations using ray tracing to follow signal propagation to the conjugate hemisphere in two plasmaspheric density models. Results of the ray tracing simulations are further compared with VPM measurements to determine which model provides better agreement with observations. As ray propagation largely depends on the background plasma density distribution, this indirect method can be used for plasmaspheric density model validation as an alternative to multipoint in situ plasma measurements that may not be readily obtainable (cf Figure below). In addition, it can be used to investigate Landau damping and ducted versus non-ducted propagation of VLF signals.
Usanova, M. E., Reid, R. A., Xu, W., Marshall, R. A., Starks, M. J., & Wilson, G. R. (2022). Using VLF transmitter signals at LEO for plasmasphere model validation. Journal of Geophysical Research: Space Physics, 127, e2022JA030345.
Link at https://doi.org/10.1029/2022JA030345
18- ULF Wave Modeling, Effects, and Applications: Accomplishments, Recent Advances, and Future
Ultra Low Frequency (ULF) waves play important roles in magnetosphere-ionosphere coupling, ring current and radiation belt dynamics, and modulation of higher frequency wave modes and energetic particle precipitation. The “ULF wave modeling, effects, and applications” (UMEA) focus group – part of the Geospace Environment Modeling effort from 2016 to 2021 – sought to improve understanding of the physics of ULF waves and their specification in geospace models. Through a series of in person and virtual meetings the UMEA focus group brought modelers and experimentalists together to compare ULF wave outputs in different models, plan observation campaigns focused on ULF waves, discuss recent advances in ULF wave research, and identify unresolved ULF wave science questions. This article summarizes major discussion points and accomplishments in the UMEA focus group over the last 6 years, recent advances and their connection to Richard Thorne and Peter Gary’s significant contributions to ULF wave research, and the future of ULF wave research.
Hartinger MD, Takahashi K, Drozdov AY, Shi X, Usanova ME and Kress B (2022) ULF Wave Modeling, Effects, and Applications: Accomplishments, Recent Advances, and Future. Front. Astron. Space Sci. 9:867394. doi: 10.3389/fspas.2022.867394
Link at doi: 10.3389/fspas.2022.867394
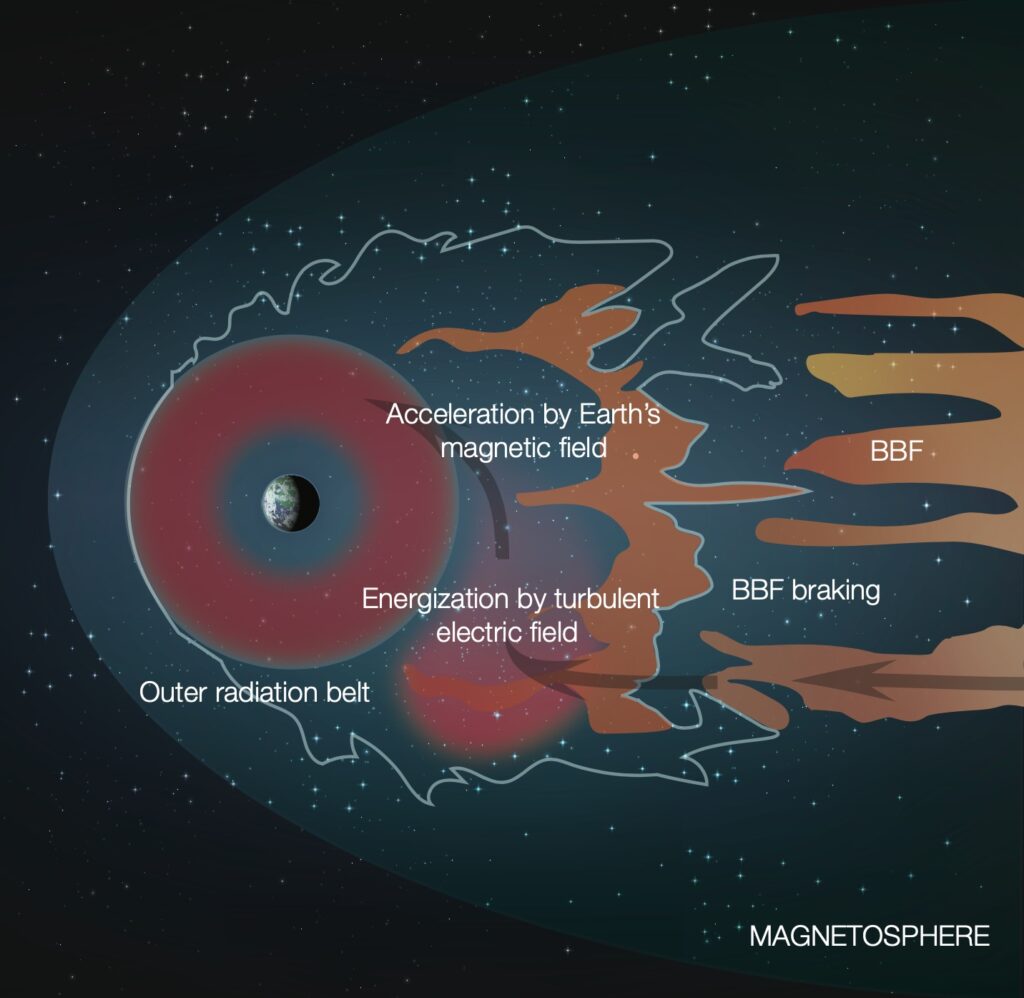
19 & 20- Bursty Bulk Flow Turbulence as a Source of Energetic Particles to the Outer Radiation Belt
Bursty Bulk Flows are thought to be the earthward-traveling exhaust from magnetic reconnection events in the Earth’s magnetotail. These plasma flows slow and divert as they approach Earth and, in doing so, can generate strong plasma turbulence. The electric field turbulence, in turn, appears to energize electrons and ions. The primary finding of this research is that the electron energization favors electrons that already have high energy, and therefore results in “acceleration” in which a relatively few particles receive a disproportionate share of the energy. Furthermore, turbulent regions of bursty bulk flows are shown to penetrate to the edge of the outer radiation belt. As such, bursty bulk flows are potentially a significant source or seed population for radiation belt electrons.
In this study, we report observations of a Bursty Bulk Flow (BBF) penetrating close to the outer edge of the radiation belt. The turbulent BBF braking region is characterized by ion velocity fluctuations, magnetic field (B) variations, and intense electric fields (E). In this event, energetic (>100 keV) electron and ion fluxes are appreciably enhanced. Importantly, fluctuations in energetic electrons and ions suggest local energization. Using correlation distances and other observed characteristics of turbulent E, test-particle simulations support local energization by E that favors higher-energy electrons and leads to an enhanced energetic shoulder and tail in the electron distributions. The energetic shoulder and tail could be amplified to MeV energies by adiabatic transport into the radiation belt where |B| is higher. This analysis suggests that turbulence generated by BBFs can, in part, supply energetic particles to the outer radiation belt and that turbulence can be a significant contributor to particle acceleration.
Ergun, R. E., Usanova, M. E., Turner, D. L., & Stawarz, J. E. (2022). Bursty bulk flow turbulence as a source of energetic particles to the outer radiation belt. Geophysical Research Letters, 49, e2022GL098113. https://doi. org/10.1029/2022GL098113
Link at https://doi. org/10.1029/2022GL098113
See also: Usanova, M.E., & Ergun, R.E. (2022). Electron Energization by High-Amplitude Turbulent Electric Fields: A Possible Source of the Outer Radiation Belt. Journal of Geophysical Research: Space Physics, 127, e2022JA030336. https://doi.org/10.1029/2022JA030336
Link at https://doi.org/10.1029/2022JA030336
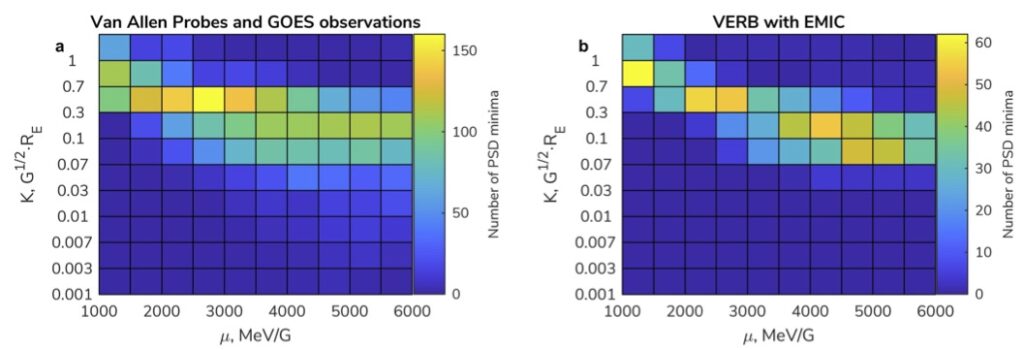
21- Depletions of Multi‐MeV Electrons and Their Association to Minima in Phase Space Density
In this study, we explore the distribution of extremely high energy electrons that surround near-Earth space (from ∼20,000 km up to ∼35,000 km). Such electrons are trapped by the Earth’s magnetic field, forming the radiation belts. There are several mechanisms of how such electrons can vanish. So-called phase space density profiles help us to distinguish between different causes of electron loss. Our statistical analysis of the minima in the phase space density profiles and additional comparison with the depletions of measured electron fluxes showed that a fast localized loss process is frequently acting in the heart of the outer radiation belt. We associate this loss process with wave–particle interactions between electrons
and electromagnetic ion cyclotron (EMIC) waves. This conclusion is confirmed by global modeling and demonstrates the importance of EMIC waves in the dynamics of the radiation belts.
Fast-localized electron loss, resulting from interactions with electromagnetic ion cyclotron (EMIC) waves, can produce deepening minima in phase space density (PSD) radial profiles. Here, we perform a statistical analysis of local PSD minima to quantify how readily these are associated with radiation belt depletions. The statistics of PSD minima observed over a year are compared to the Versatile Electron Radiation Belts (VERB) simulations, both including and excluding EMIC waves. The observed minima distribution can only be achieved in the simulation including EMIC waves, indicating their importance in the dynamics of the radiation belts. By analyzing electron flux depletions in conjunction with the observed PSD minima, we show that, in the heart of the outer radiation belt (L* < 5), on average, 53% of multi-MeV electron depletions are associated with PSD minima, demonstrating that fast localized loss by interactions with EMIC waves are a common and crucial process for ultra-relativistic electron populations.
Drozdov, A. Y., Allison, H. J., Shprits, Y. Y., Usanova, M. E., Saikin, A., & Wang, D. (2022). Depletions of multi-MeV electrons and their association to minima in phase space density. Geophysical Research Letters, 49, e2021GL097620. https://doi.org/10.1029/2021GL097620